Jetson Monitor is a real-time web-based monitoring dashboard specifically designed for NVIDIA Jetson devices. This Flask-based application provides comprehensive system monitoring with a focus on the unique capabilities and thermal characteristics of Jetson hardware.
The project emerged from the need to monitor Jetson devices in real-time, particularly their thermal behavior and GPU utilization, which are critical for maintaining optimal performance in edge computing applications.
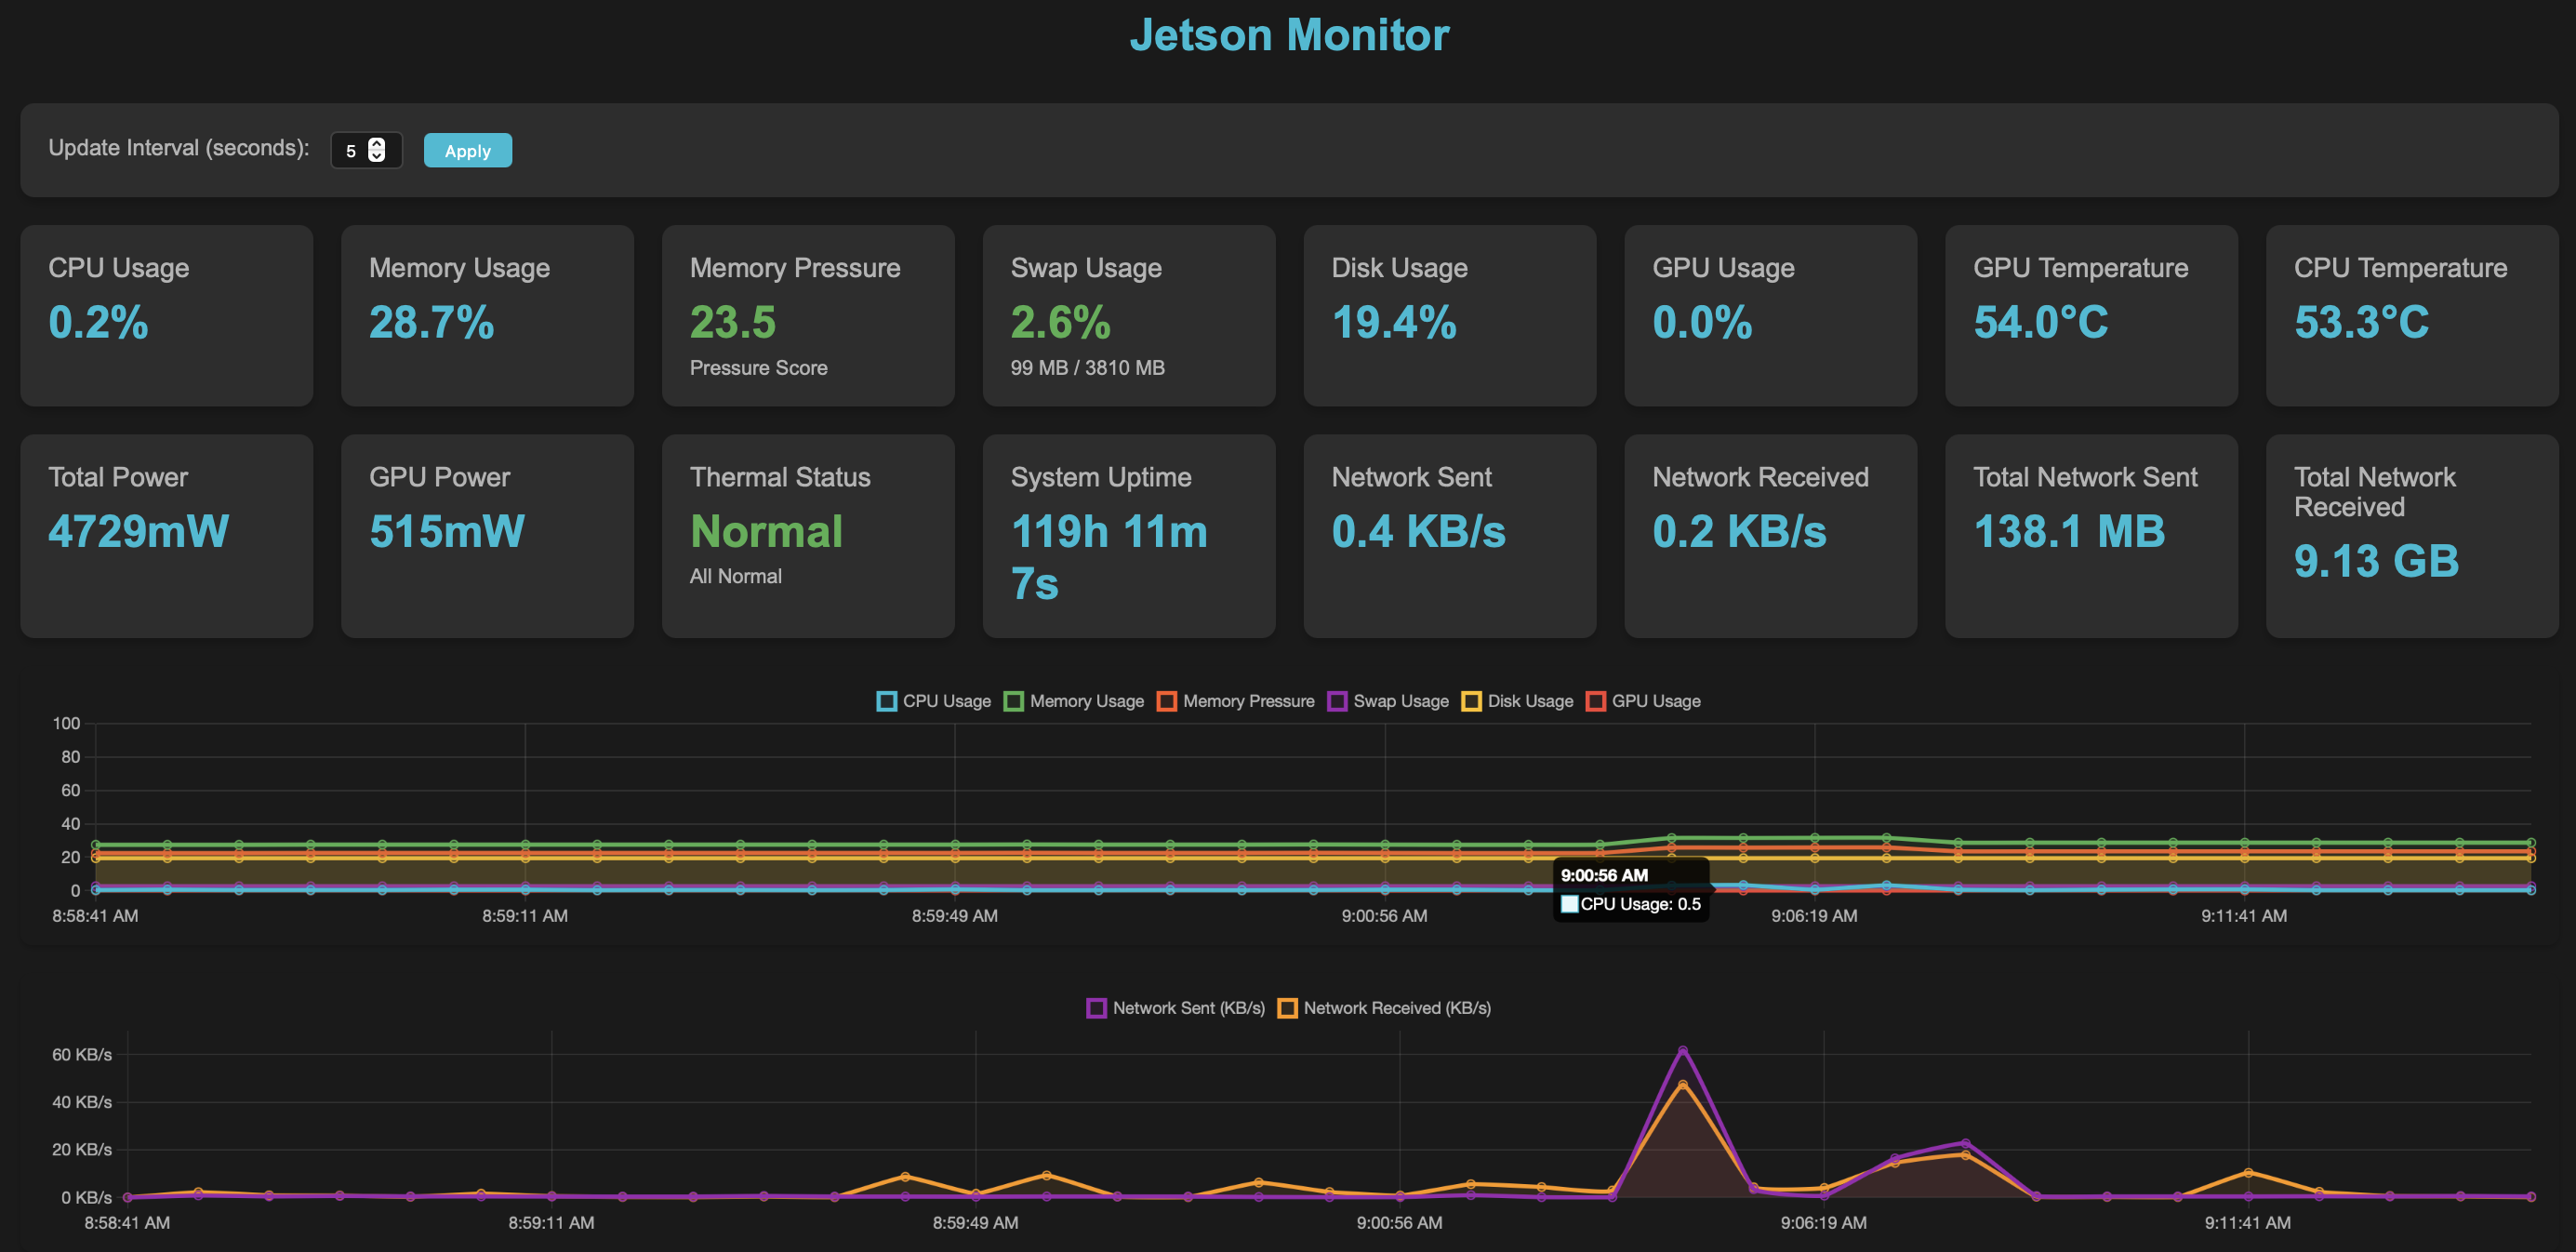
Features
System Monitoring
- CPU & Memory: Real-time CPU usage, memory consumption, and swap utilization
- Storage: Disk space monitoring with visual indicators
- Network: Live network throughput tracking (sent/received data rates)
- Uptime: System uptime tracking and display
GPU Monitoring
- GPU Utilization: Real-time GPU usage percentages
- GPU Temperature: Continuous thermal monitoring
- Power Consumption: GPU and total system power draw tracking
- Performance Metrics: Comprehensive GPU performance data via NVIDIA ML
Thermal Management
- Thermal Status: Real-time thermal state monitoring
- Throttling Detection: CPU and GPU throttling alerts
- Visual Indicators: Color-coded status system (Green/Yellow/Red)
- Event Reporting: Detailed thermal event logging
Memory Pressure Analysis
- Pressure Scoring: Intelligent memory pressure calculation (0-100 scale)
- Weighted Algorithm:
- Memory usage (60% weight)
- Swap usage (30% weight)
- Available memory (10% weight)
- Visual Alerts: Color-coded pressure indicators
Technical Implementation
Backend Architecture
The application is built with Flask 3.0.2 and leverages several key libraries:
- psutil 5.9.8: System and process monitoring
- nvidia-ml-py3 7.352.0: NVIDIA GPU monitoring via NVML
- Real-time Updates: WebSocket-like updates via AJAX polling
Frontend Design
- Modern Dark Theme: Responsive design optimized for monitoring scenarios
- Interactive Charts: Real-time data visualization with historical tracking
- Mobile-Friendly: Responsive layout that works on various screen sizes
- Configurable Updates: Adjustable refresh intervals (1-60 seconds)
Data Visualization
- Real-time Charts: Interactive graphs showing the last 60 data points
- Historical Tracking: Persistent data visualization across sessions
- Performance Metrics: Visual representation of all monitored parameters
Use Cases
This monitoring solution is particularly valuable for:
- Edge Computing: Monitoring Jetson devices in remote or embedded applications
- Development: Real-time performance analysis during application development
- Thermal Analysis: Understanding thermal behavior under different workloads
- System Administration: Remote monitoring of Jetson-based systems
- Research: Performance analysis for AI/ML workloads on edge devices